---
title: Getting started with Neon and New Relic
subtitle: Send Neon metrics and Postgres logs to New Relic using the OpenTelemetry integration
author: dhanush-reddy
enableTableOfContents: true
createdAt: '2025-09-11T00:00:00.000Z'
updatedOn: '2025-09-11T00:00:00.000Z'
---
[New Relic](https://newrelic.com/) is an observability platform that helps you visualize, analyze, and troubleshoot your entire software stack. [Neon's OpenTelemetry (OTEL) integration](/docs/guides/opentelemetry) allows you to send your project's metrics and Postgres logs directly to New Relic, giving you a centralized view of your database's performance and activity.
This guide will walk you through setting up the integration between Neon and New Relic. You'll learn how to:
- Find the required credentials in New Relic to set up an OTLP endpoint.
- Set up the OpenTelemetry integration in your Neon project.
- Verify that your Neon metrics and logs are successfully flowing into New Relic.
- Build an example dashboard in New Relic to visualize your Neon metrics.
By the end, you'll have a complete observability pipeline from your Neon database to your New Relic dashboard.
## Prerequisites
Before you begin, ensure you have the following:
- **Neon account and project:** If you don't have one, sign up at [Neon](https://console.neon.tech/signup). Your Neon project must be on the **Scale** or **Business** plan to use the OpenTelemetry integration.
- **New Relic account:** A New Relic account with access to your Ingest License Key. A free-tier account is sufficient to start. You can sign up at [New Relic](https://newrelic.com/signup).
## Set up the New Relic OTLP endpoint
First, you need the correct credentials from New Relic to send OpenTelemetry data. This involves getting your Ingest License Key and the correct OTLP endpoint URL.
1. Log in to your [New Relic account](https://one.newrelic.com/).
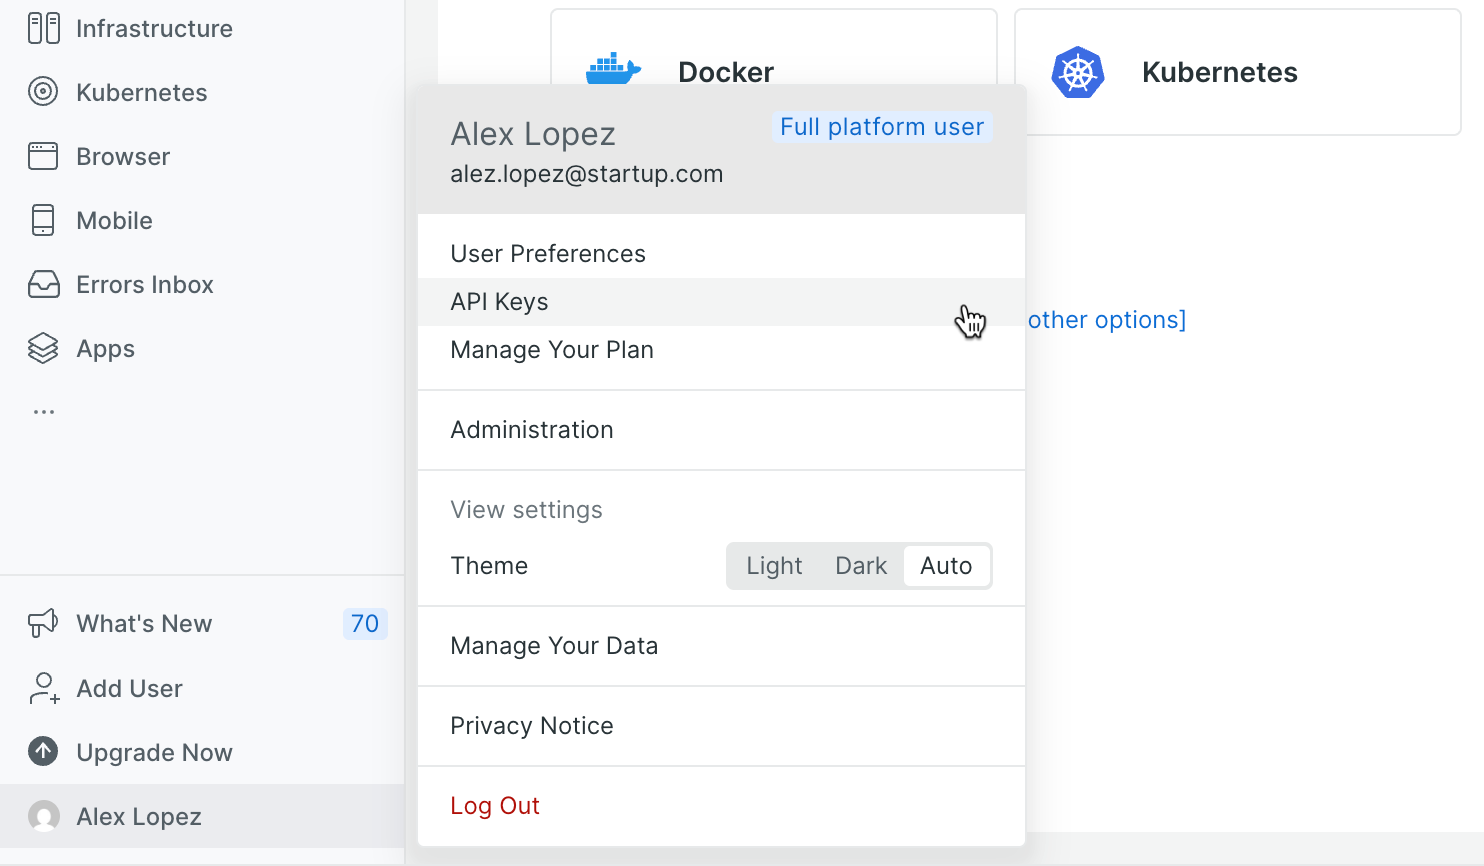
2. Create a New Relic License Key:
- Click on your user icon in the bottom left corner.
- Select **API keys** from the menu.
If you get stuck in New Relic's onboarding screens and don't see a way to proceed, try opening the Logs or Data Explorer pages in a new browser tab. This can sometimes let you access the main New Relic UI and continue with your setup.
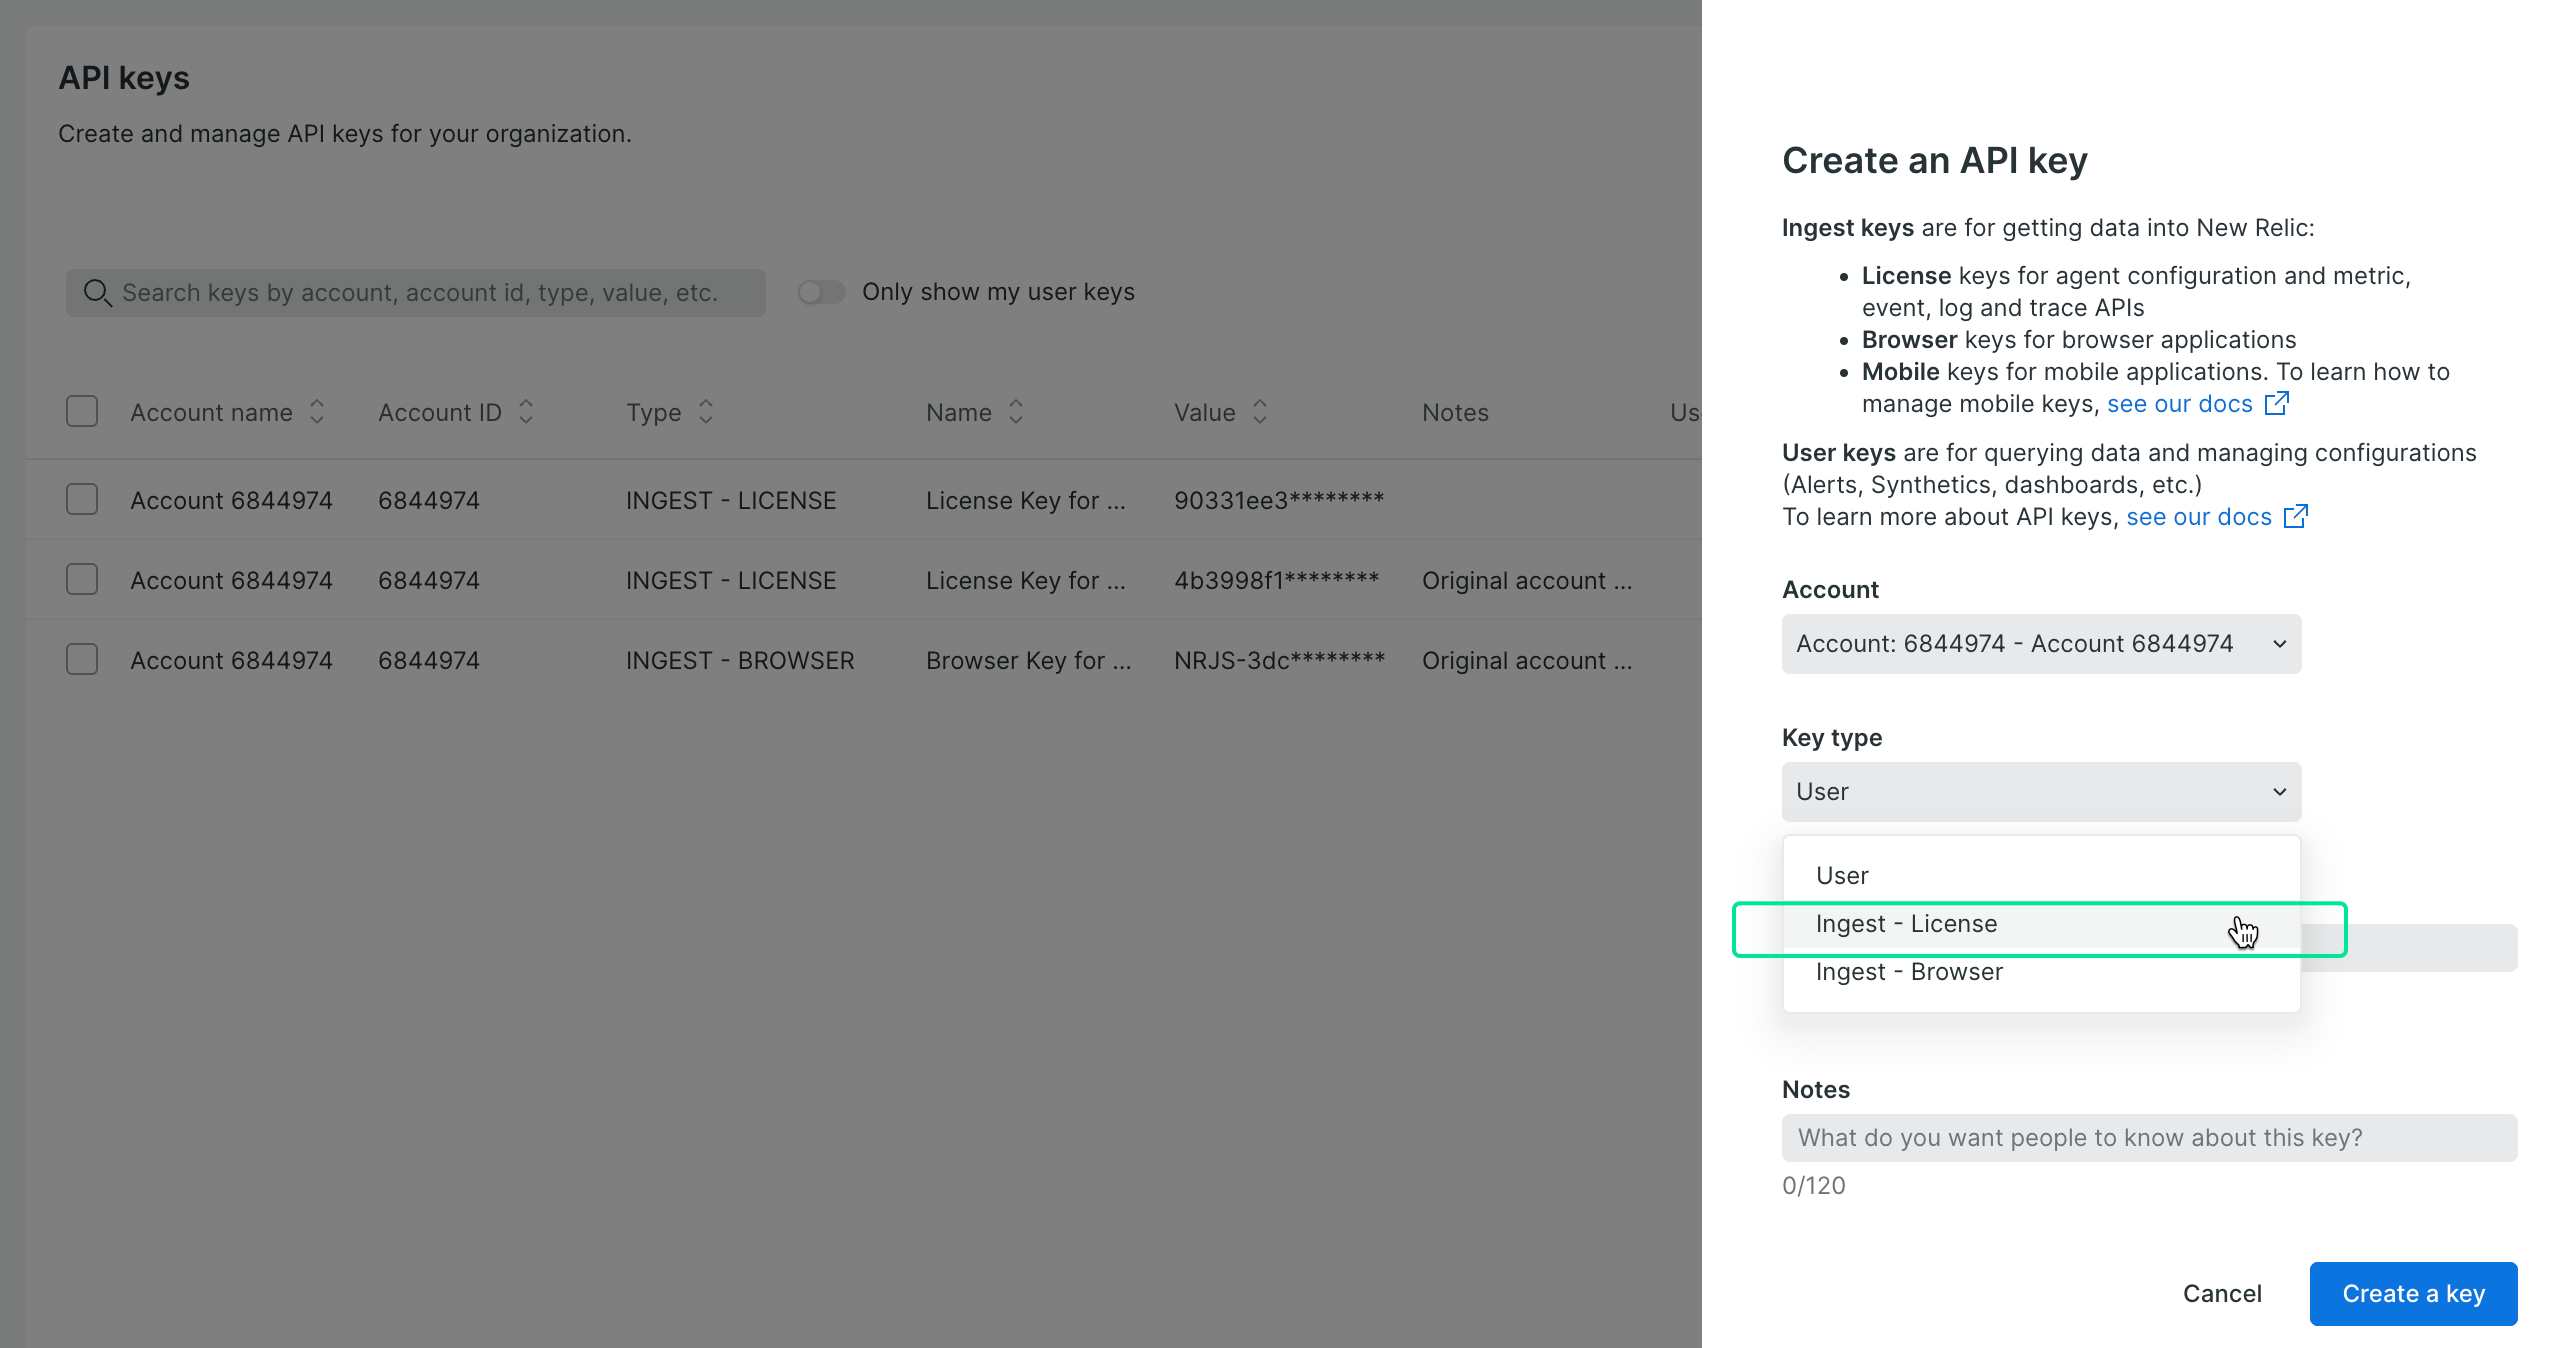
3. On the API keys page, create a key of the type `INGEST - LICENSE`. Save the key as you won't be able to view it again.
4. Identify your OTLP endpoint URL. The URL depends on your region.
- For US regions, use: `https://otlp.nr-data.net`
- For EU regions, use: `https://otlp.eu01.nr-data.net`
Refer to the [New Relic OTLP endpoint documentation](https://docs.newrelic.com/docs/opentelemetry/best-practices/opentelemetry-otlp/#configure-endpoint-port-protocol) for the correct URL for your account.
> Keep the **Ingest License Key** and the **OTLP endpoint URL** handy. You will need them in the next step to configure Neon.
## Configure the Neon OpenTelemetry integration
Now, you will use the credentials from New Relic to configure the integration in your Neon project.
1. Navigate to the [Neon Console](https://console.neon.tech) and select your project.
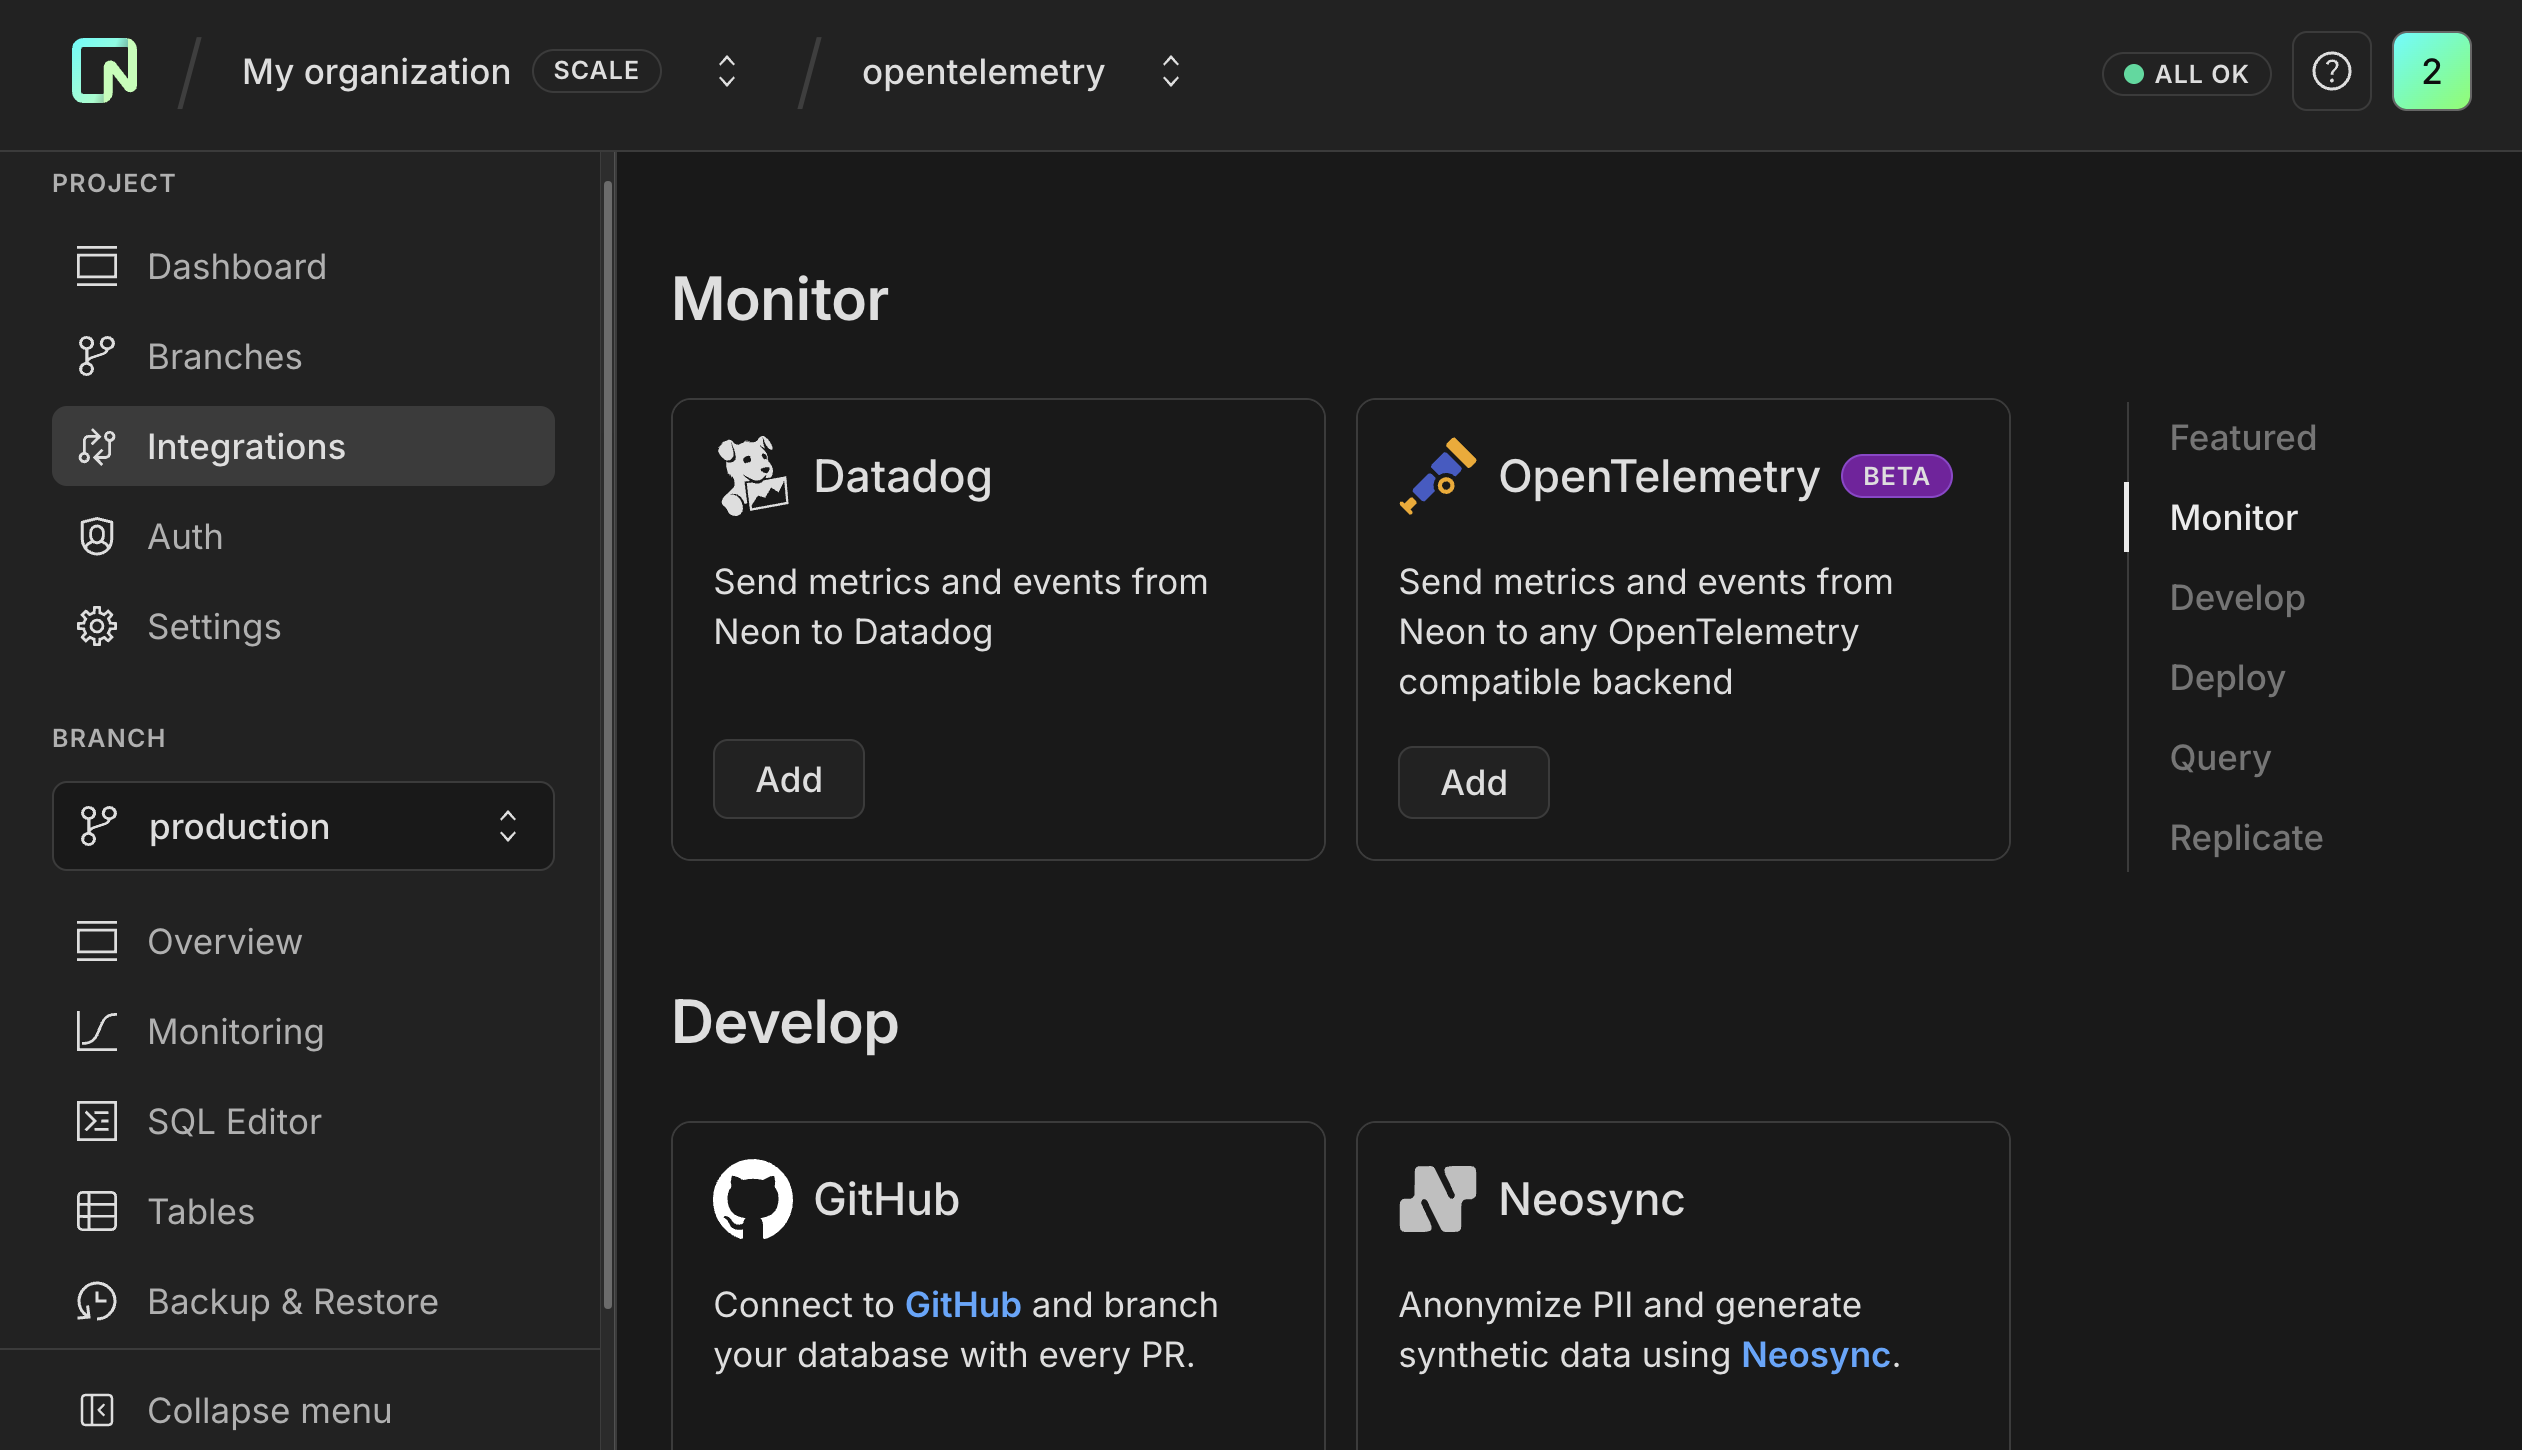
2. From the sidebar, go to the **Integrations** page.
3. Find the **OpenTelemetry** card and click **Add**.
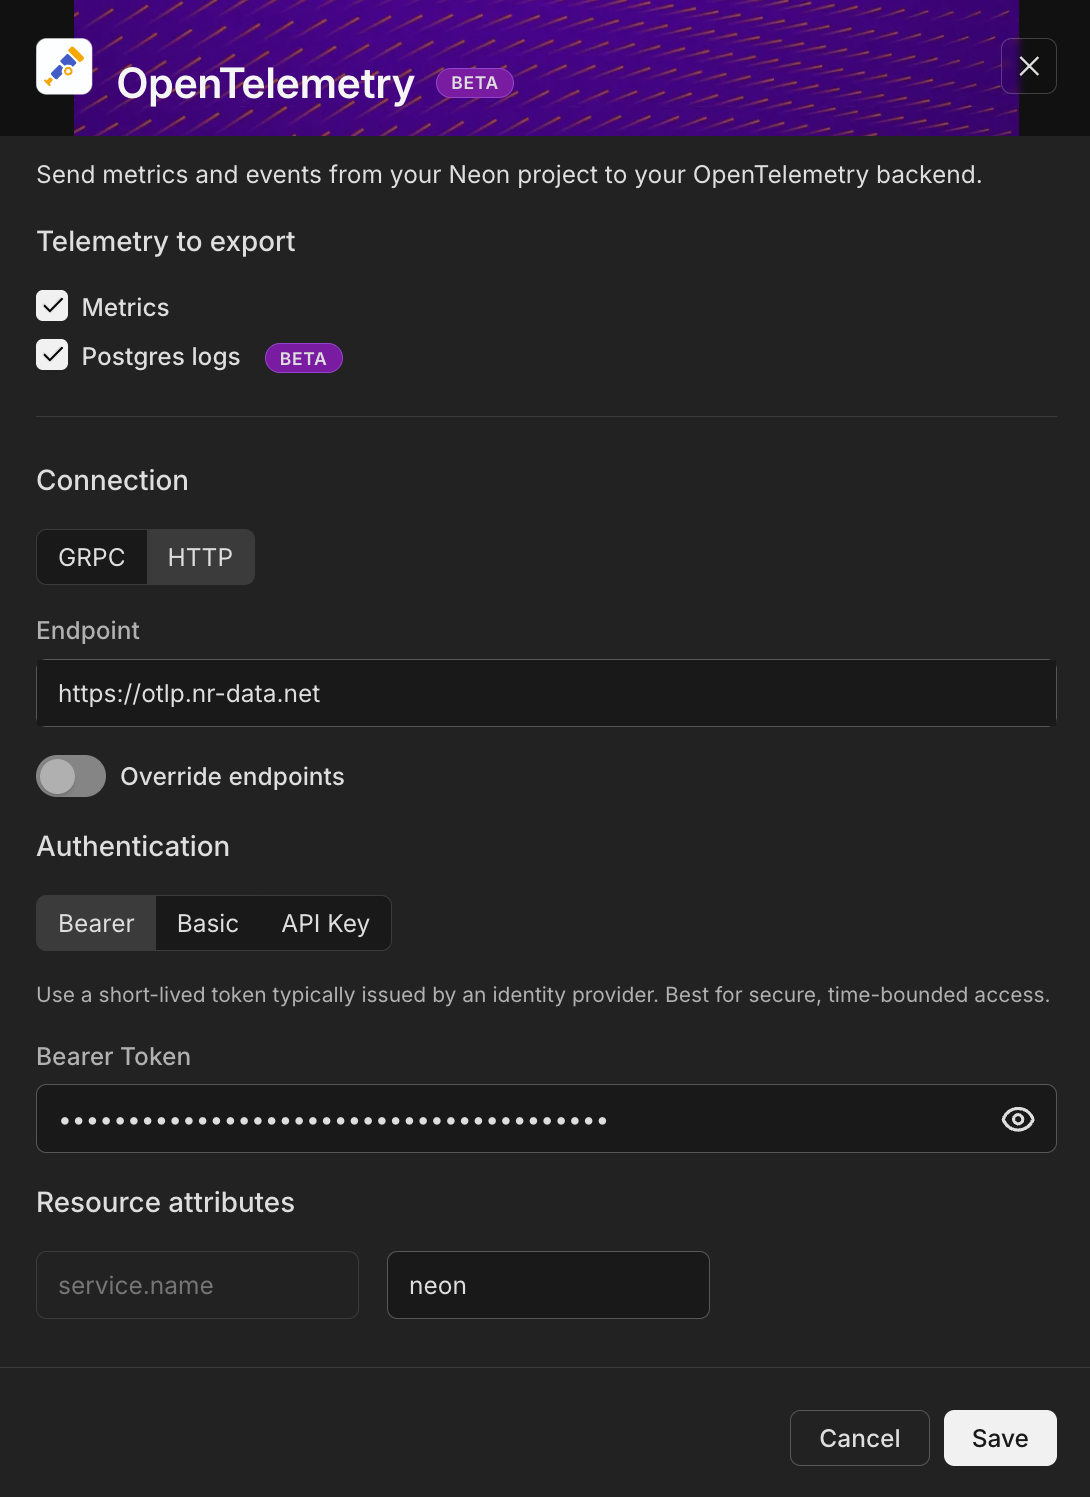
4. A sidebar form will open. Fill in the configuration details using the information you gathered from New Relic:
- **Telemetry to export:** Check both **Metrics** and **Postgres logs** to send all available data.
- **Connection:** Select **HTTP**.
- **Endpoint:** Paste the OTLP endpoint URL from New Relic.
- **Authentication:** Select **Bearer**.
- **Bearer Token:** Paste the **Ingest License Key** you copied from New Relic.
- **Resource attributes:** It's a best practice to add a `service.name` attribute to identify your data source within New Relic. For example, set the key to `service.name` and the value to `neon`.
- Click **Save**.
The Neon OpenTelemetry integration sends data for all computes in your Neon project. For example, if you have multiple branches, each with an attached compute, metrics and logs will be collected and sent for each one.
> The integration is now active and will begin sending data from your Neon project's computes to New Relic.
## Verify the data flow in New Relic
To confirm that your integration is working:
1. Go back to your New Relic One platform.
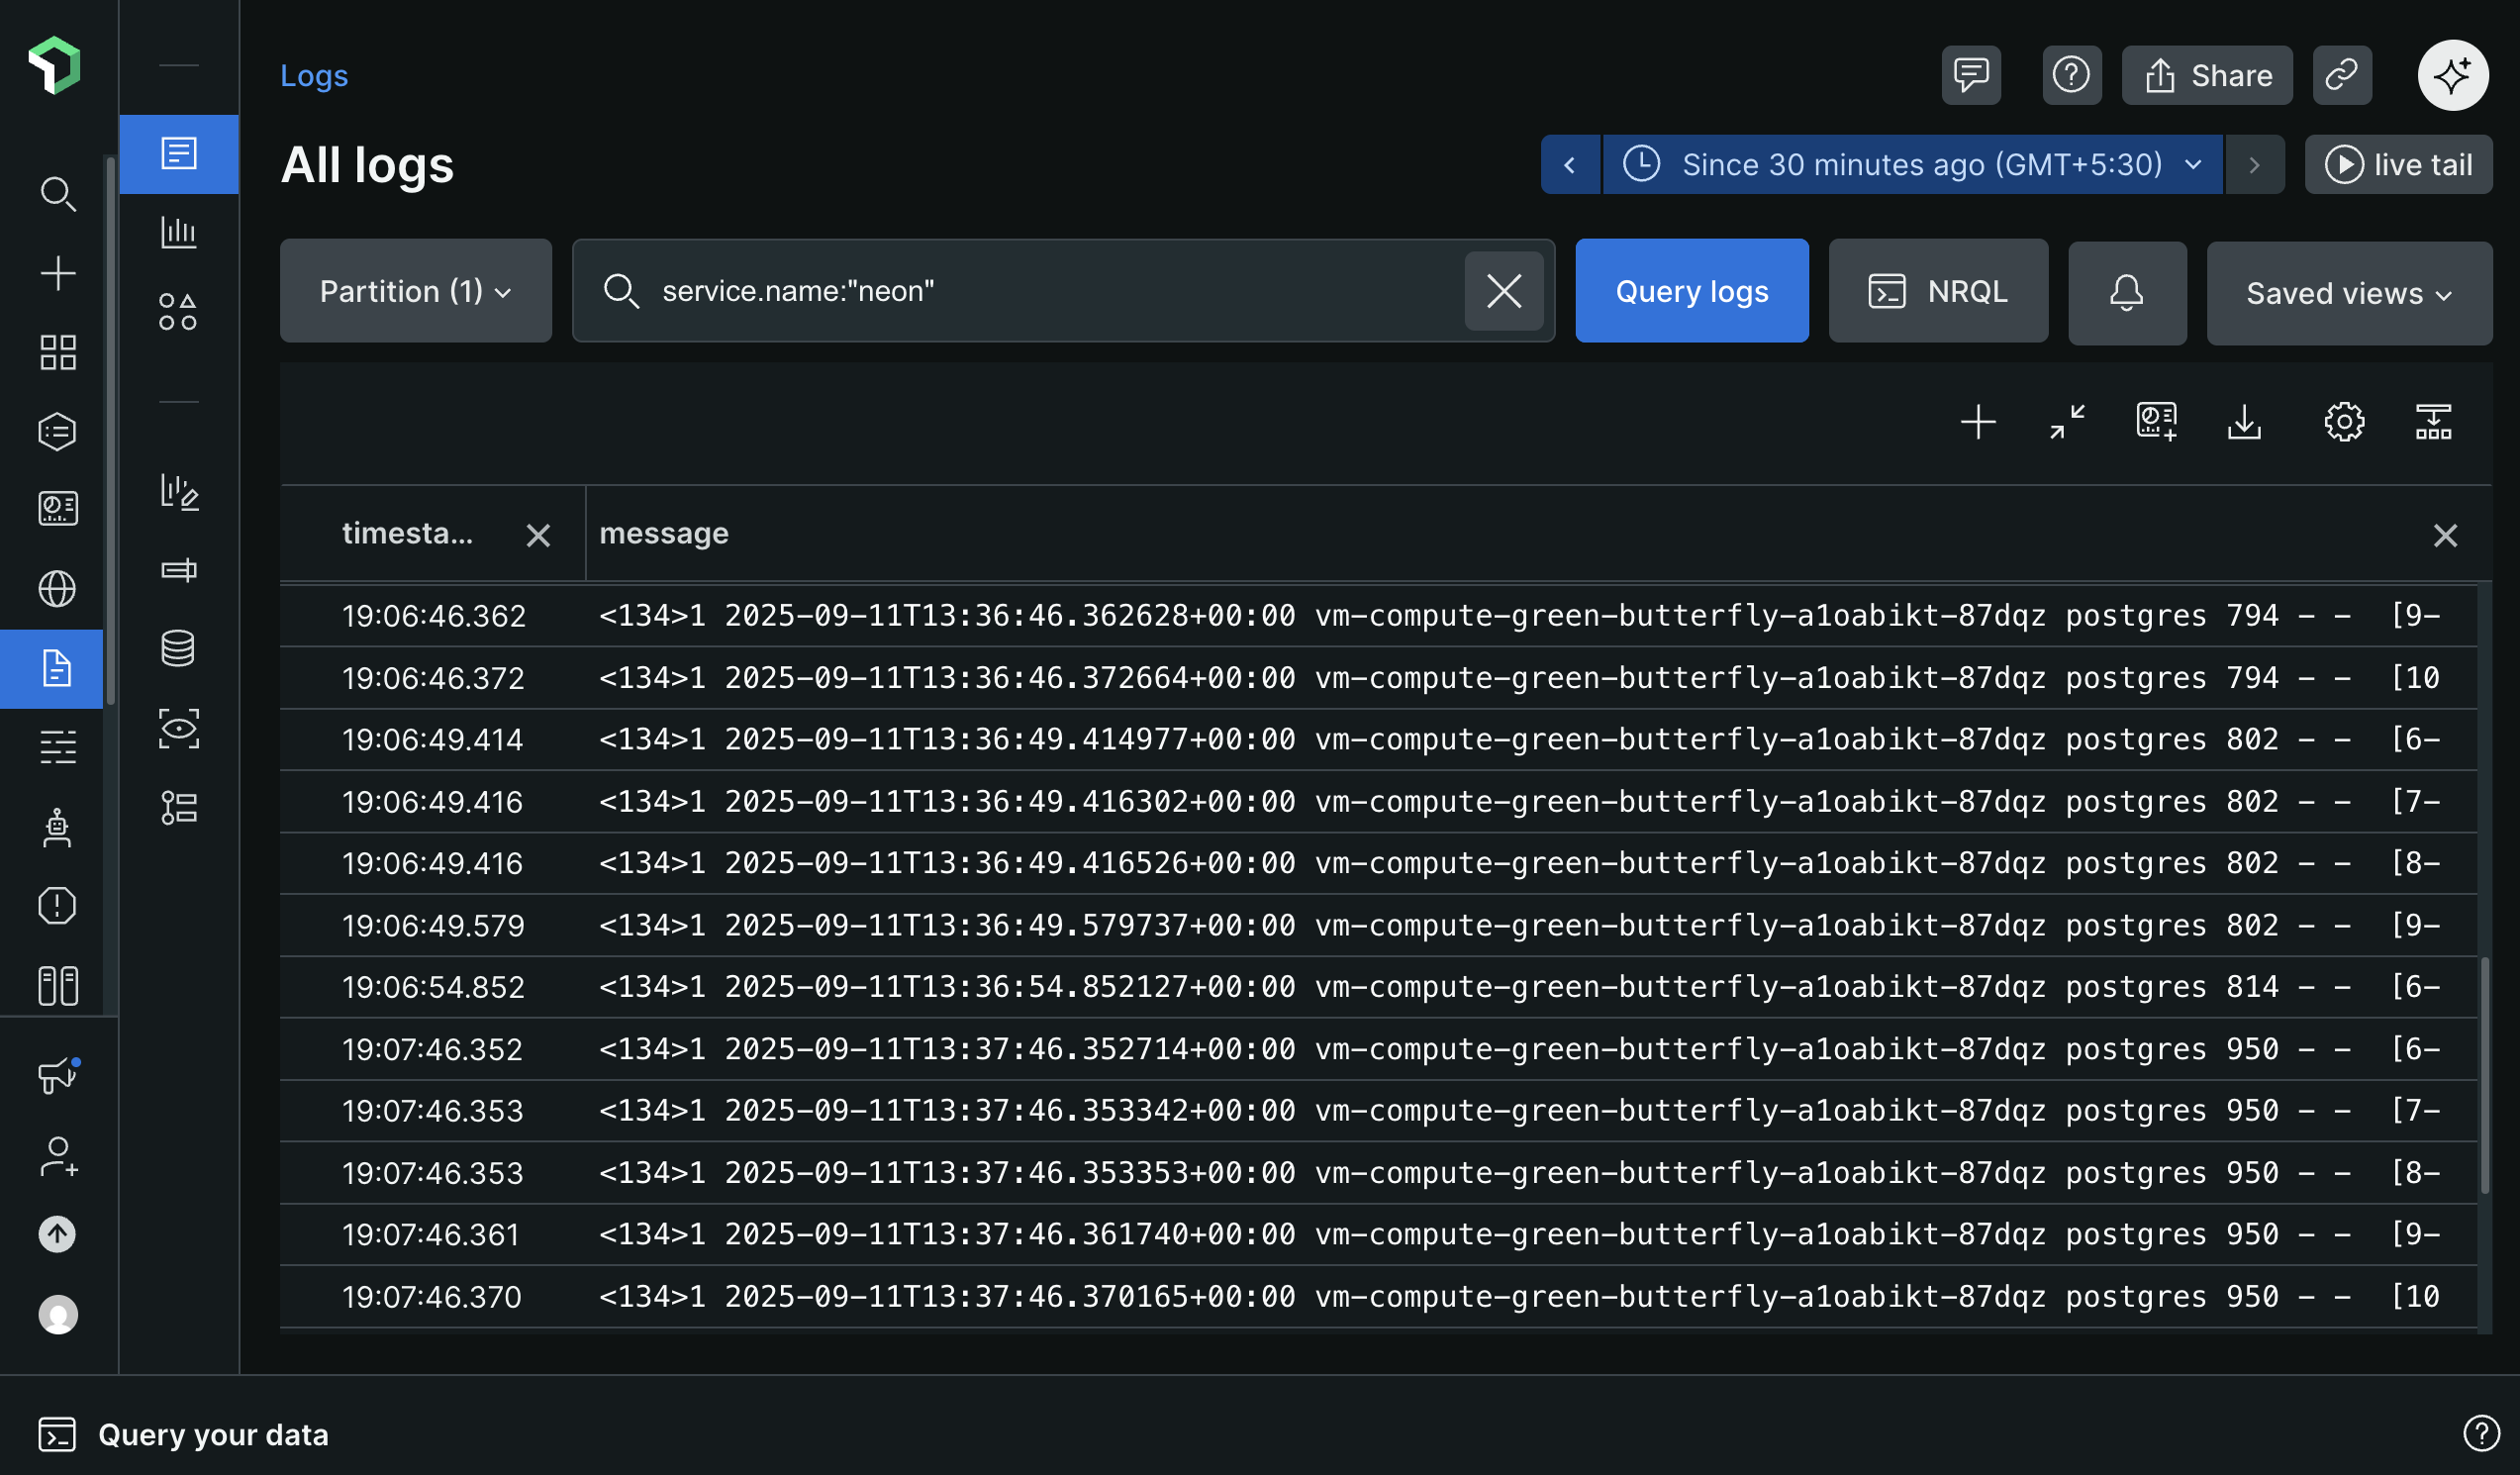
2. From the left navigation menu, select **Logs**.
3. You should see log data from your Neon project appearing in the log stream. You can use the filter bar to query for your specific service, for example: `service.name: 'neon'`.
It may take a few minutes for the first logs and metrics to appear after you enable the integration.
You should see Postgres logs from your Neon compute streaming into the New Relic Logs UI. This confirms that the integration is working correctly.
Neon computes only send logs and metrics when they are active. If you have the [Scale to Zero](/docs/manage/endpoints#scale-to-zero) feature enabled and a compute is suspended due to inactivity, no telemetry data will be sent. If you notice gaps in your data, check your compute's status on the **Branches** page in the Neon console.
## Visualizing Neon Metrics with Dashboards
While the Logs UI is perfect for real-time log inspection, New Relic's **Dashboards** are the best way to visualize your Neon metrics, track trends over time, and get a high-level overview of your database's health.
After setting up the integration, you may notice New Relic automatically creates entities like `compute-host-metrics`, `sql-metrics` and `neon` in the **APM & Services** section. This is expected behavior.
However, the APM & Services view is designed for application performance monitoring (APM) trace data, which follows a different set of semantic conventions than Neon's metrics. As a result, these service pages will appear empty or show "Required metrics are missing" warnings.
These auto-created service entities can be safely ignored. The correct way to visualize and analyze your Neon data is by querying it directly in the Logs UI and building custom Dashboards, as shown in this guide.
### Create a custom Neon dashboard
You'll create a new dashboard from scratch to visualize your Neon metrics using the New Relic Query Language (NRQL).
1. From the left navigation menu in New Relic, select **Dashboards**.
2. Click the **Create a dashboard** button.
3. Select **Create a new dashboard** option, which starts you with a blank dashboard.
4. Give your new dashboard a descriptive name, such as `Neon Project Metrics`, and click **Create**.
### Create your first chart
Add a chart to visualize a specific metric.
1. On your blank dashboard, click on **+ Add a new chart** button by hovering over the empty space.
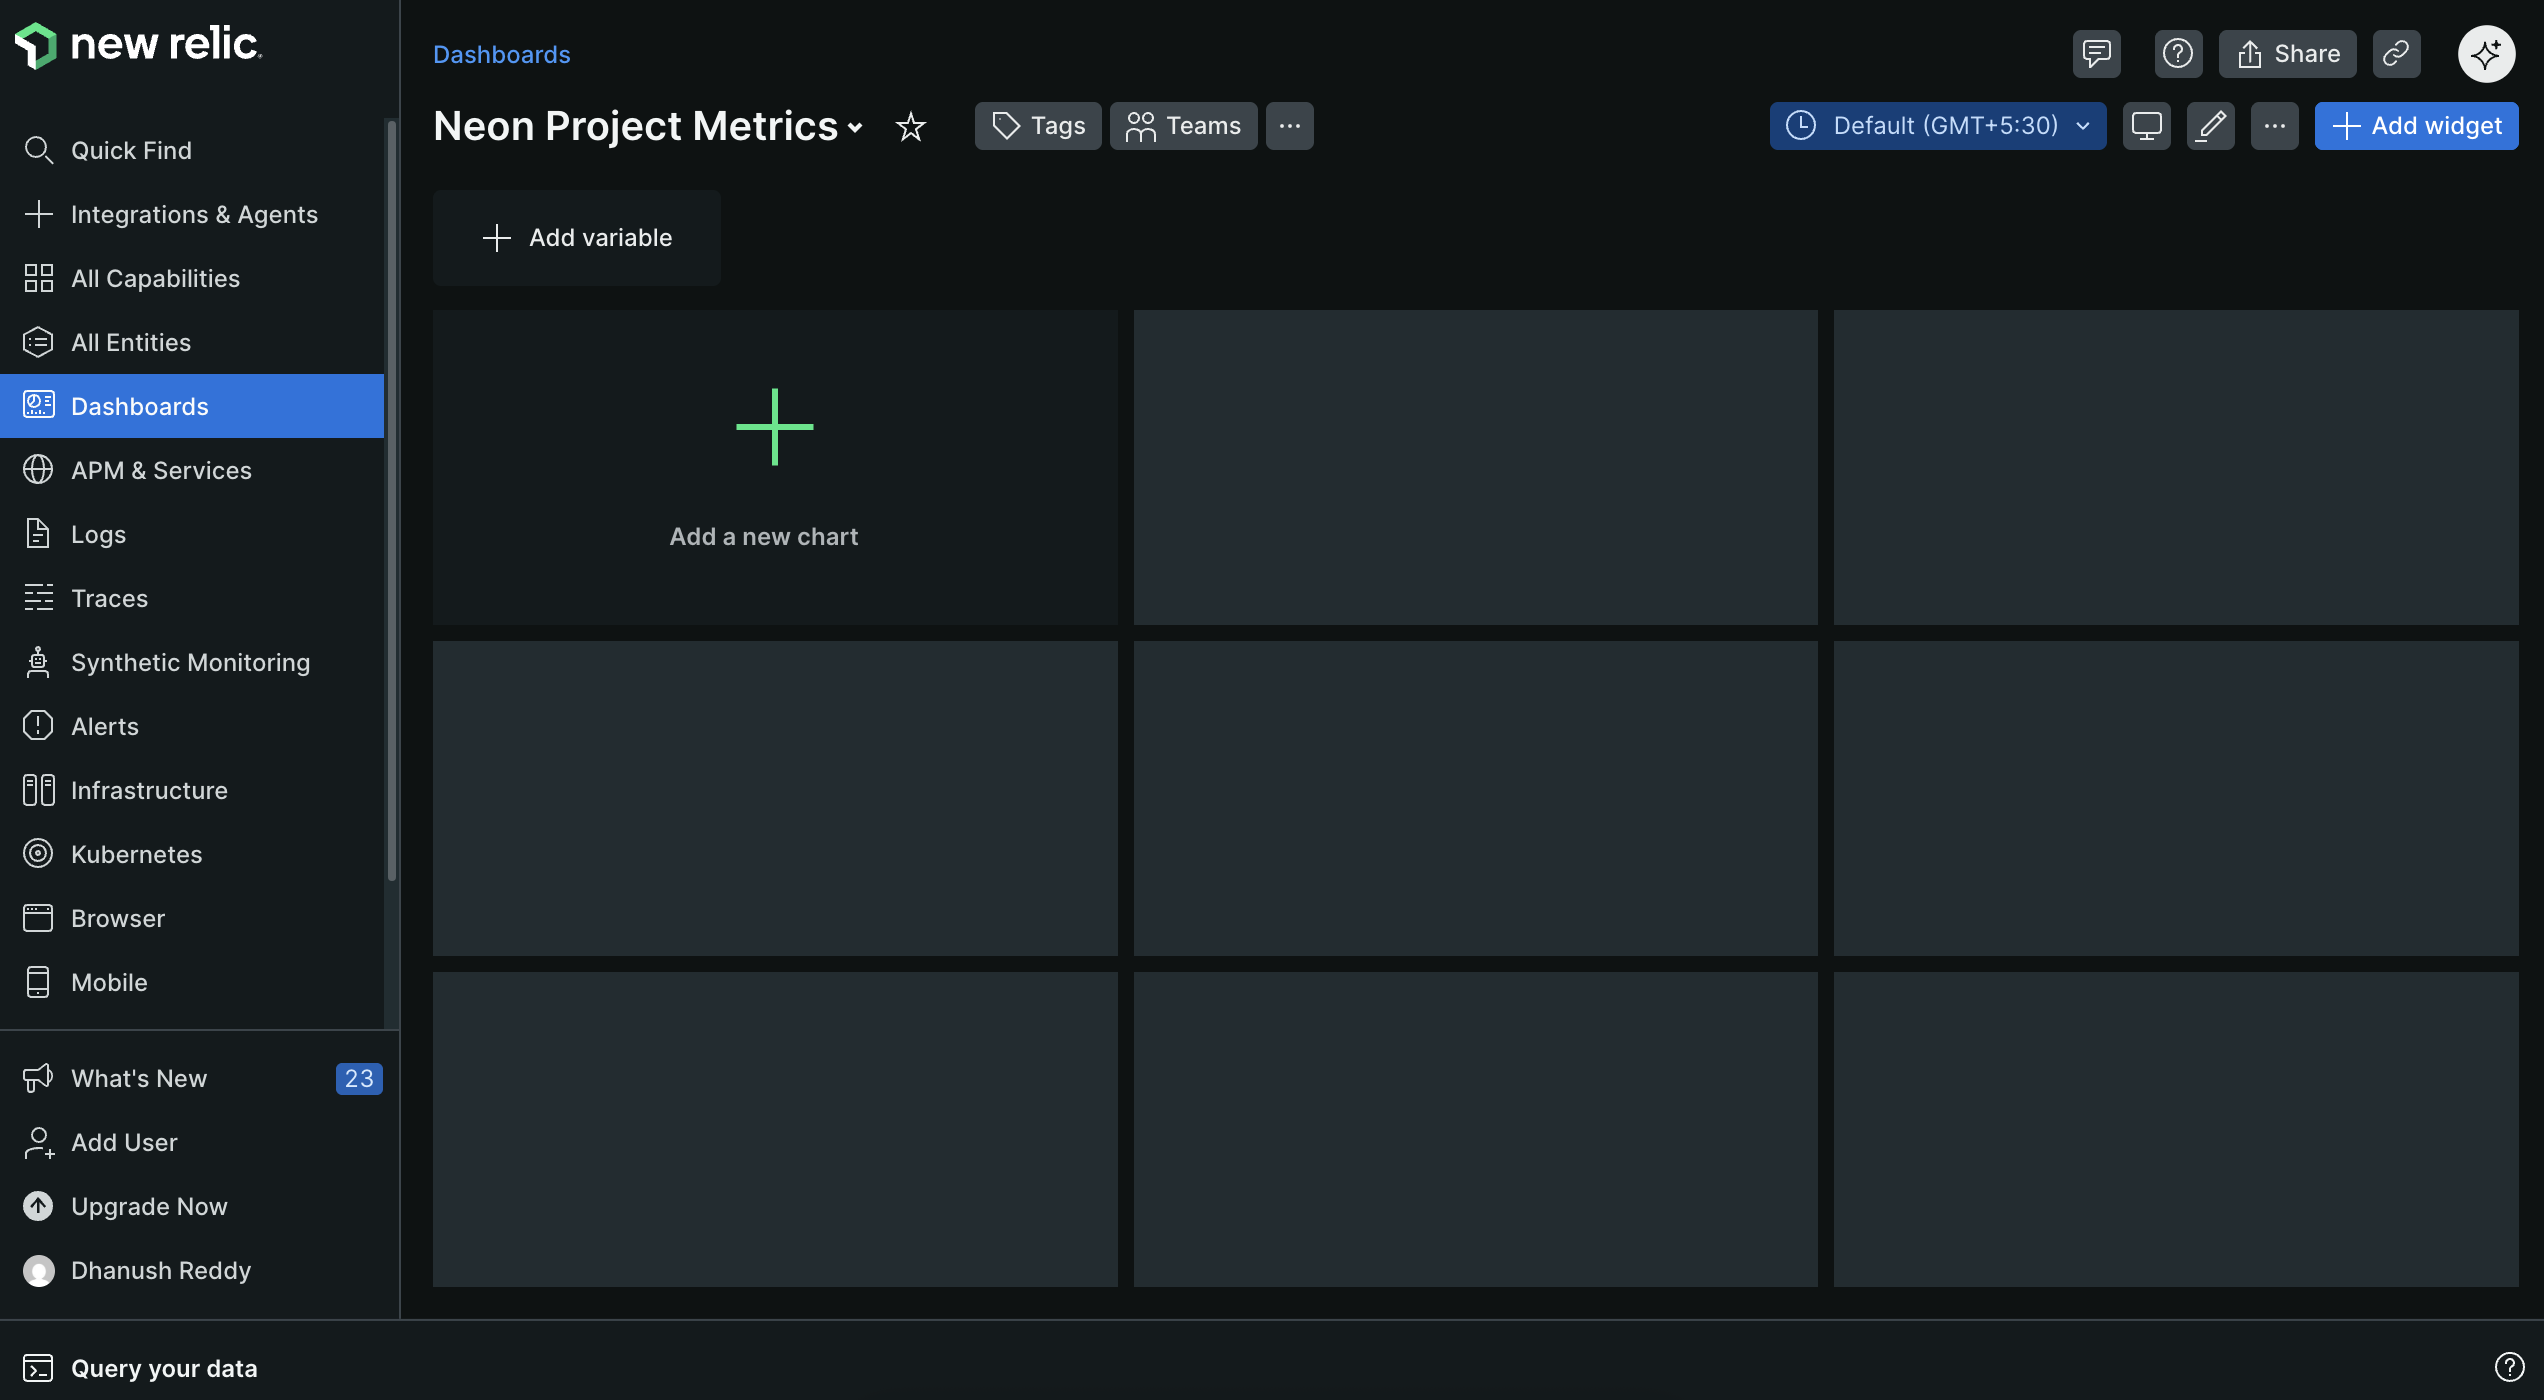
2. Select **Add a chart**.
3. In the query builder, you will use NRQL to select and visualize your metric data.
4. To visualize the maximum number of active connections to your Neon database over time, enter the following NRQL query:
```sql
FROM Metric SELECT max(neon_connection_counts)
where neon_connection_counts IS NOT NULL
TIMESERIES 1 minute
since 10 minutes ago
```
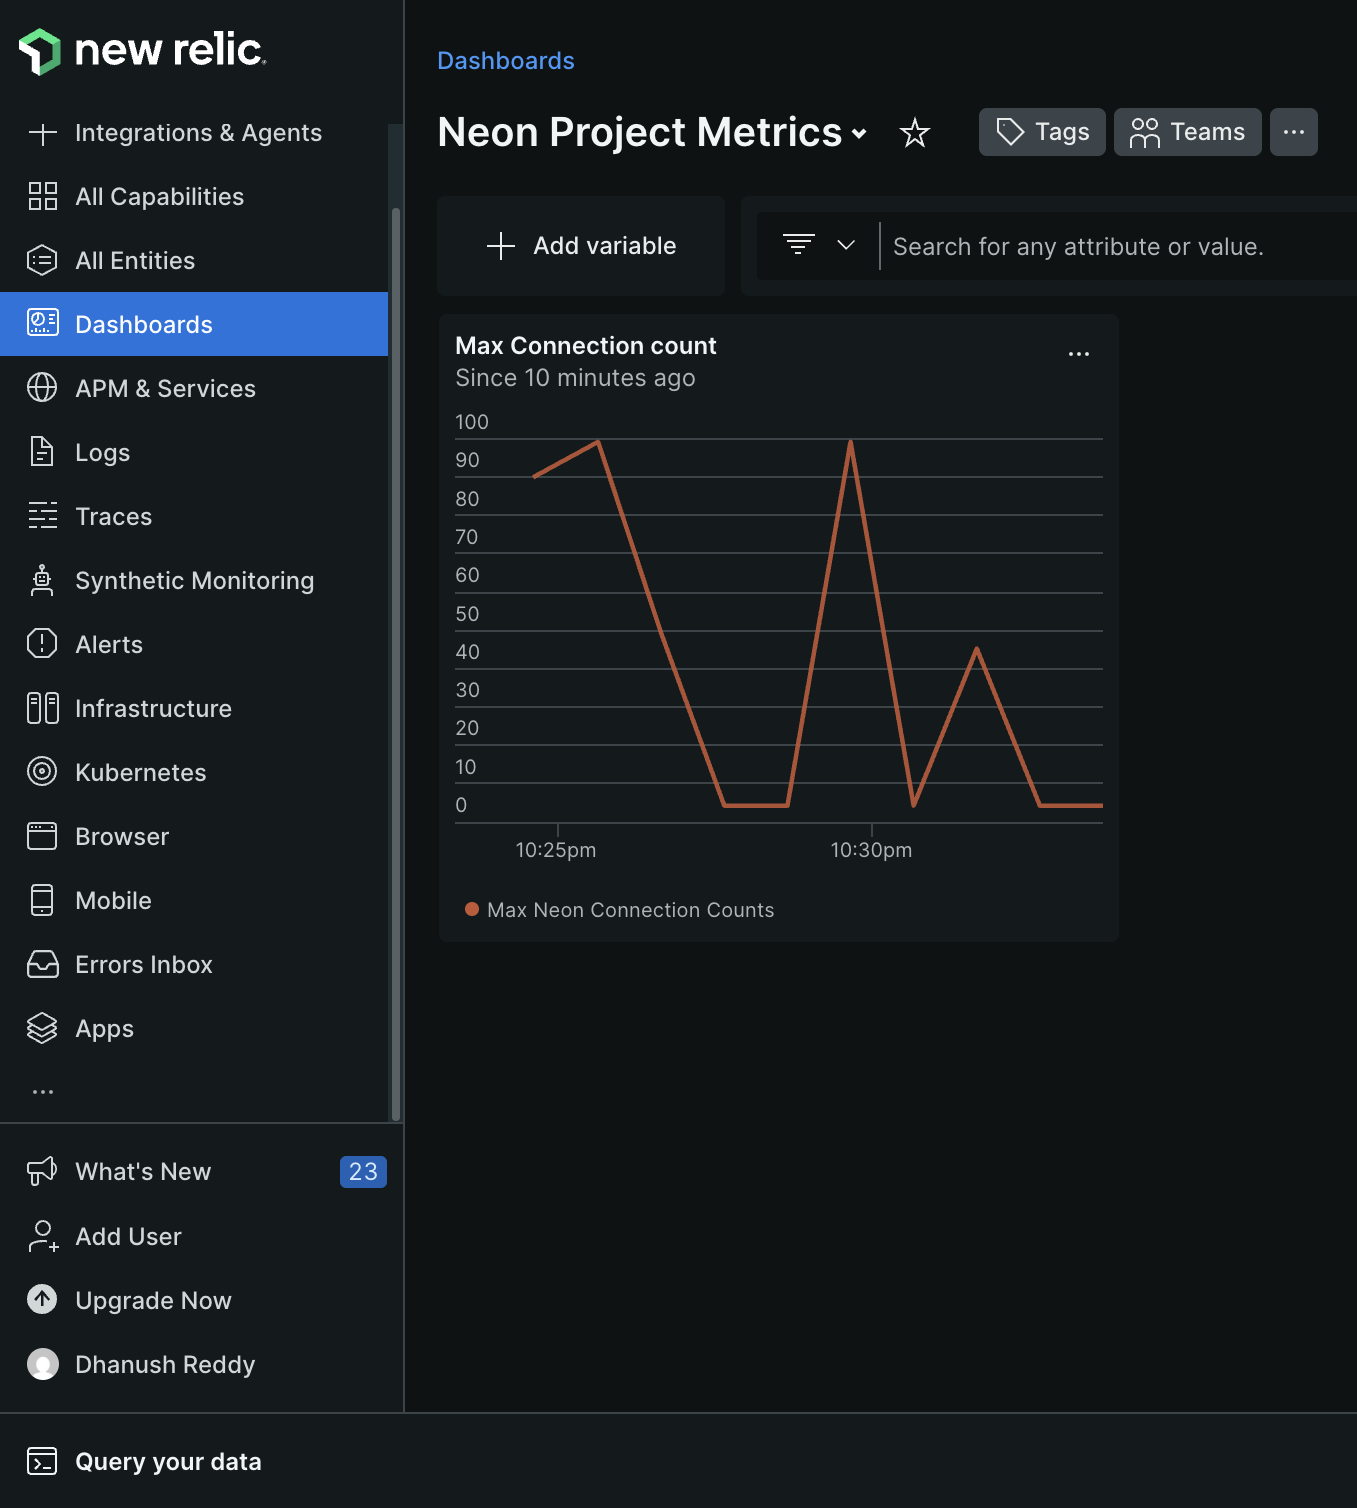
This query selects the maximum value of the `neon_connection_counts` metric, which represents the number of active connections to your database, and displays it as a time series over the last 10 minutes with data points every minute.
5. Click **Run** to see the chart populated with data.
6. You can customize the chart's appearance (e.g., line chart, area chart) using the panel on the right. Chose the style that best represents your data.
> For example, select the **Line** chart type for a clear view of connection trends over time as shown below.
> 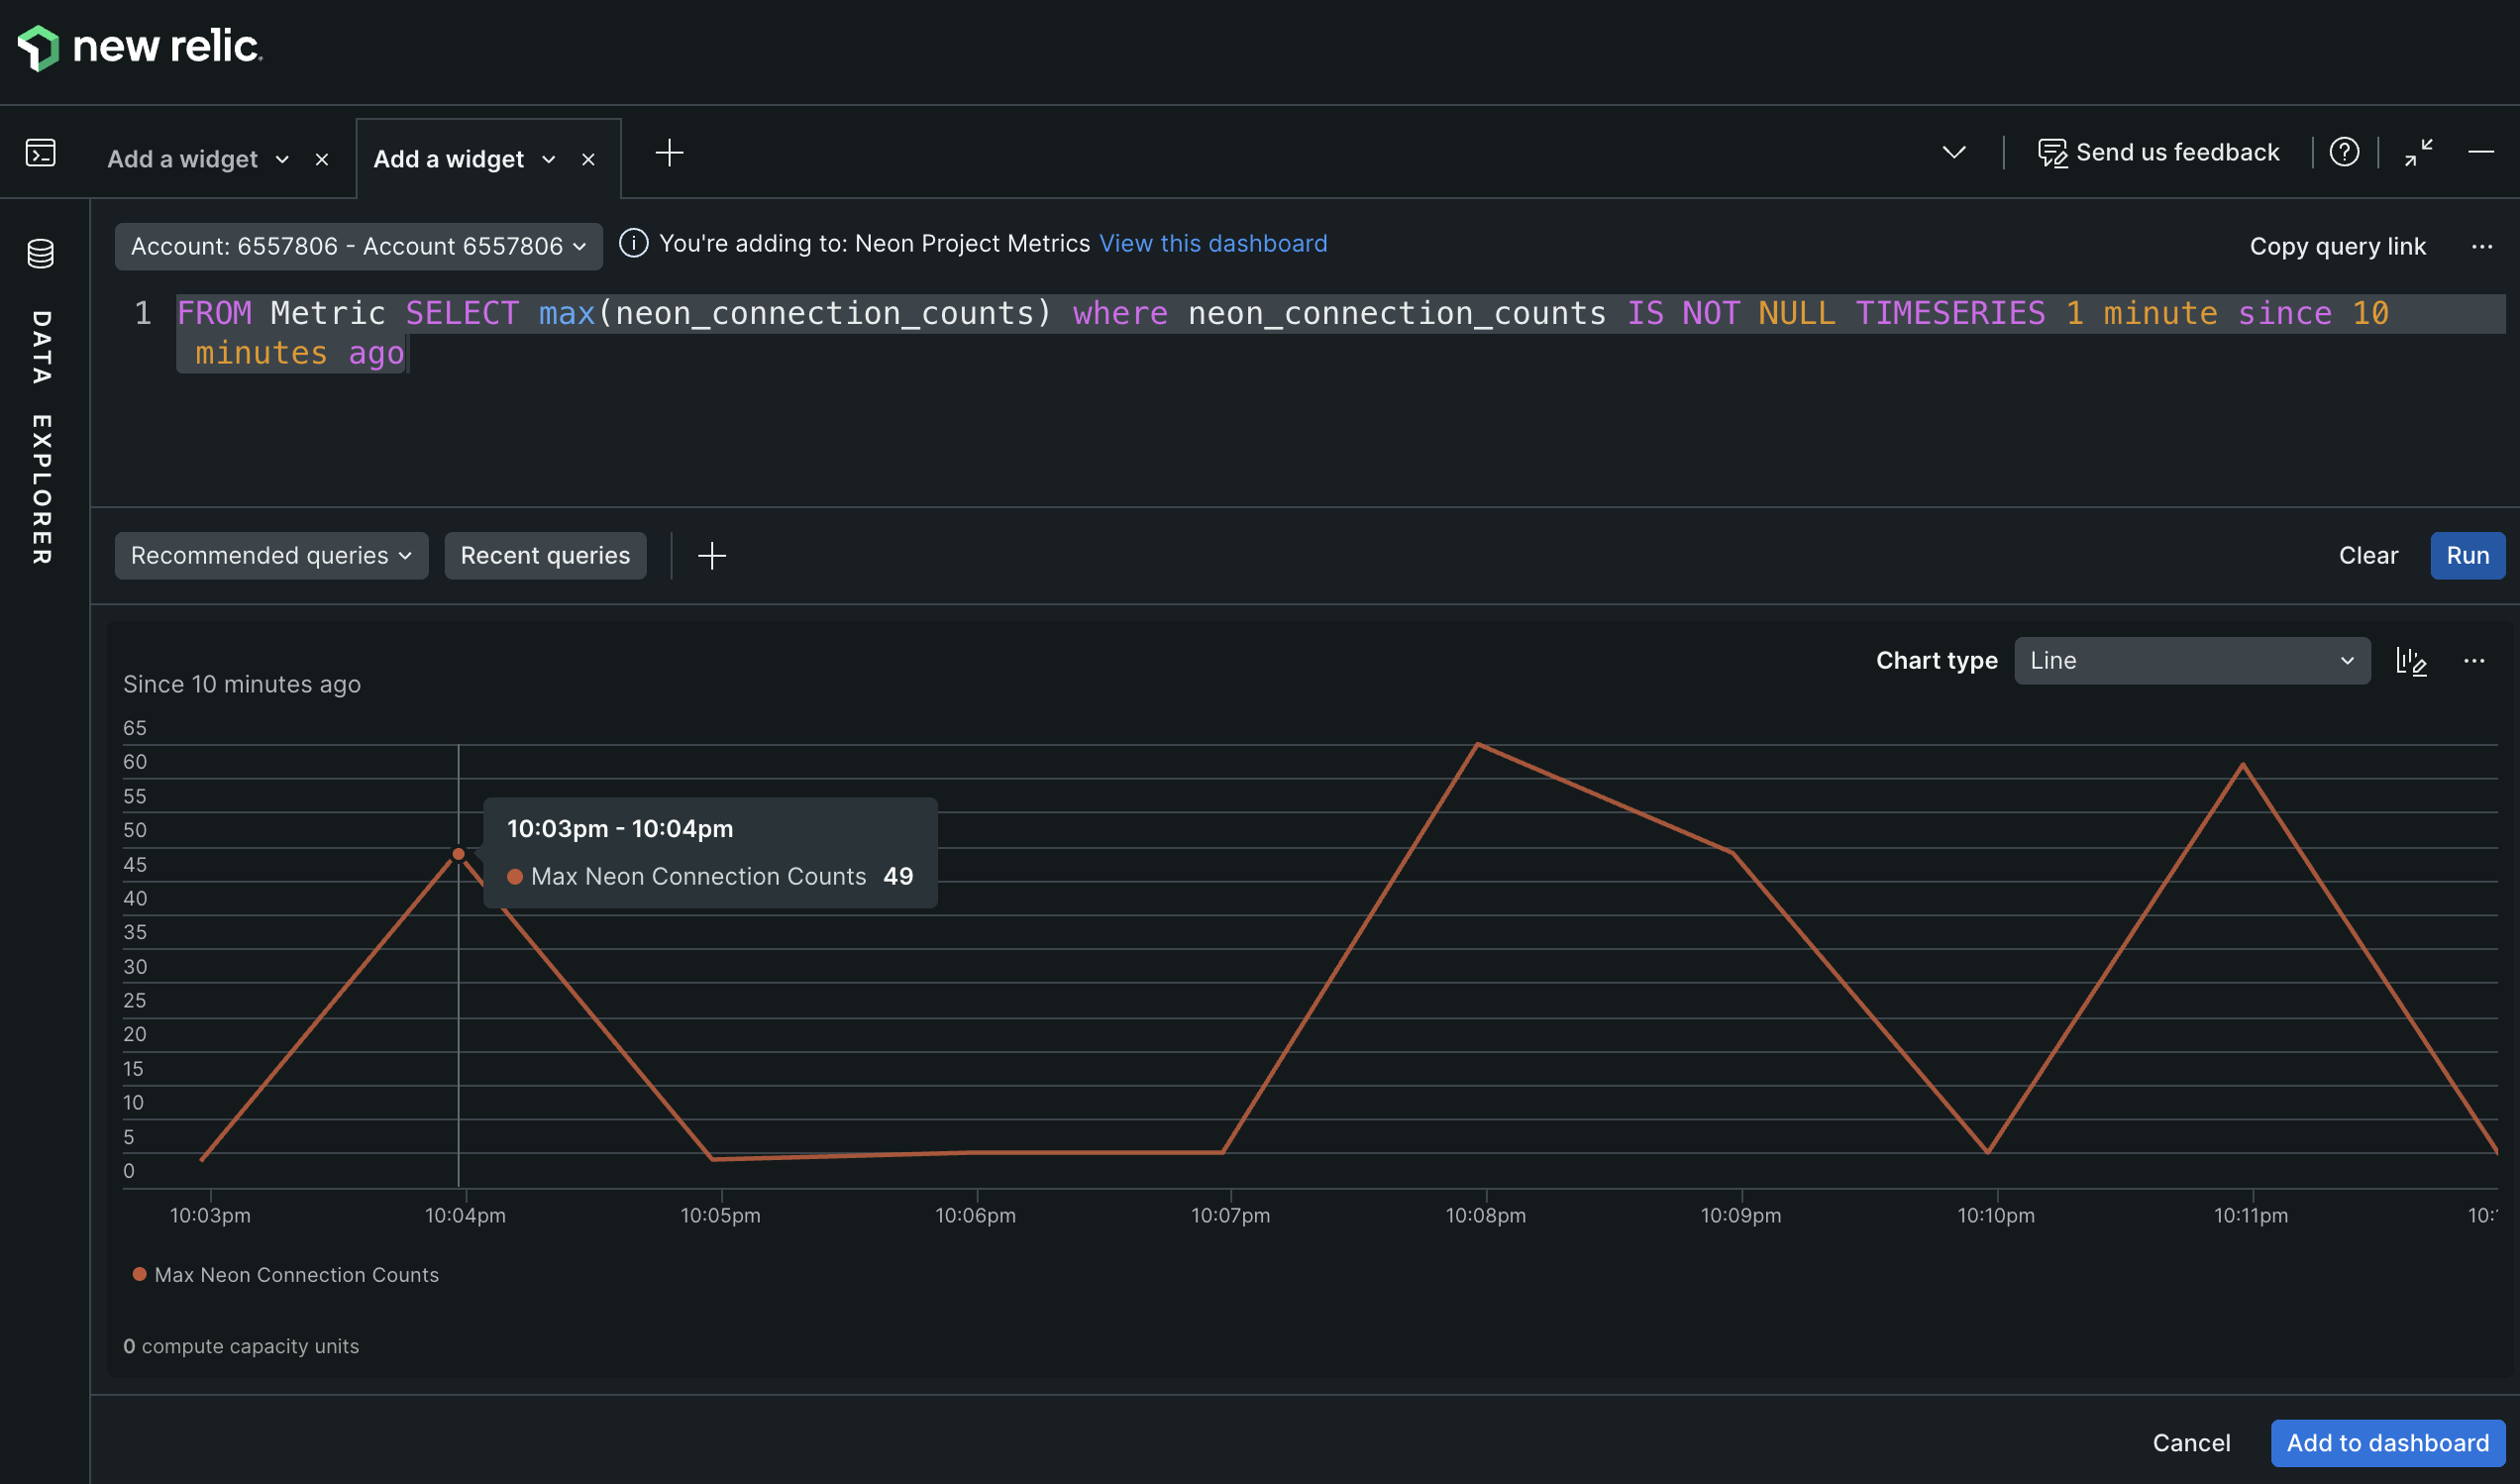
7. To view the metric on your dashboard, simply click on **Add to dashboard** on the bottom right of the query builder.
8. Your chart will now appear on your dashboard. You can resize and rearrange it as needed.
9. To add a title, click the three-dot menu (...) in the chart's corner, select Edit, and enter a descriptive name like **Max Active Connections**. Click **Apply changes** to apply the new title. This menu also allows for other customizations, such as colors and thresholds.
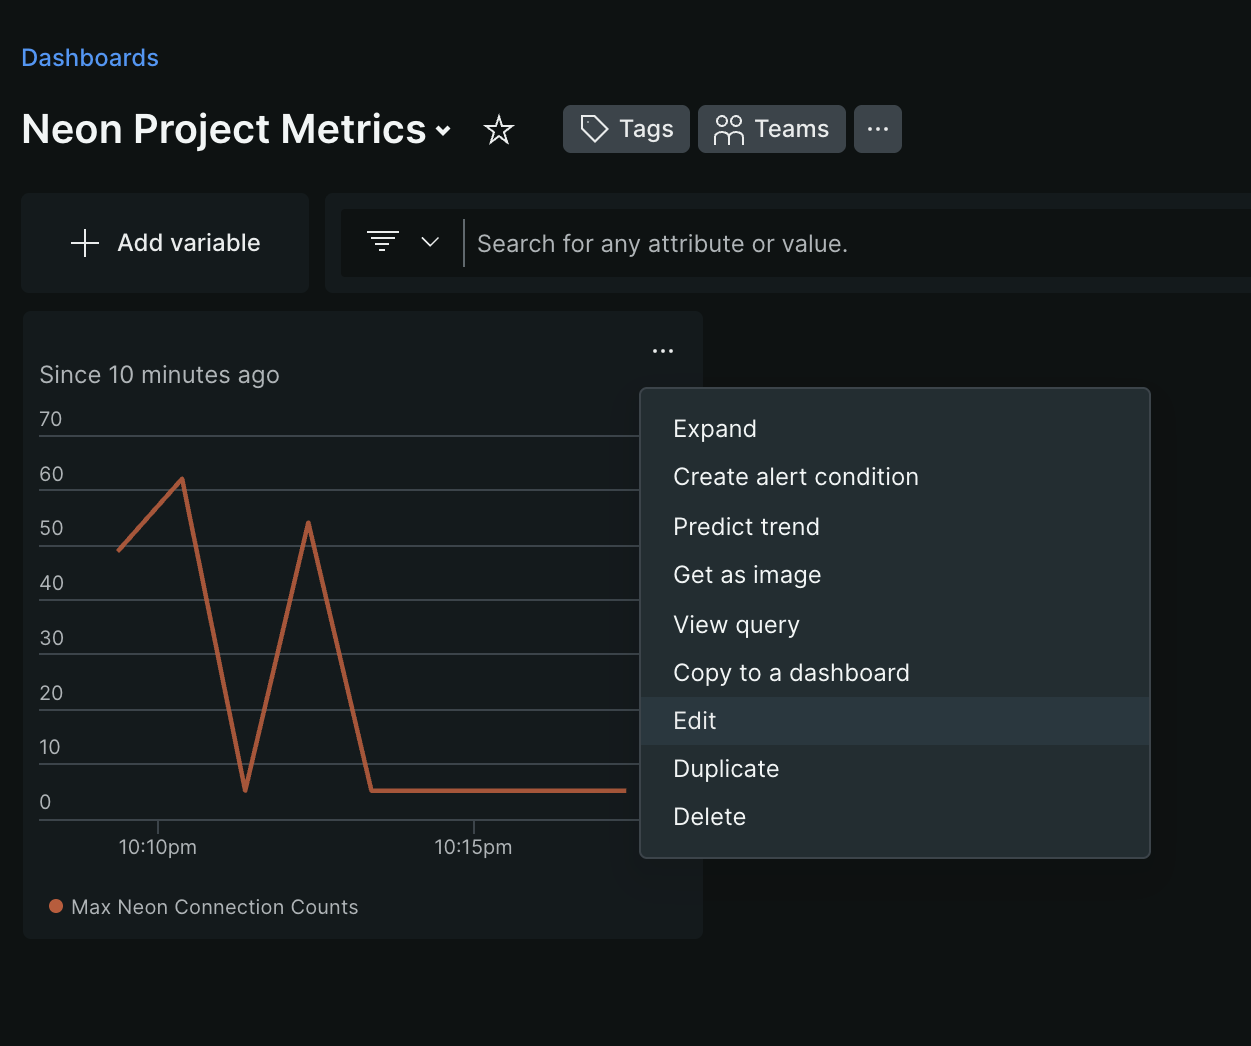
Your final chart should look something like this:
10. Repeat the process to add more charts for other Neon metrics you want to monitor. Check out the next section for all the available metrics Neon exports.
### Explore available Neon metrics
Neon exports a rich set of metrics that you can use to build your dashboards. These include both Neon-specific metrics and general compute host metrics.
Here are some example NRQL queries for other useful metrics:
- **Total database size in bytes:**
```sql
SELECT latest(neon_db_total_size) FROM Metric
WHERE neon_db_total_size is NOT NULL TIMESERIES 1 minute since 10 minutes ago
```
- **CPU usage seconds (per mode):**
```sql
SELECT rate(sum(host_cpu_seconds_total), 1 second) FROM Metric
WHERE host_cpu_seconds_total is NOT NULL FACET mode TIMESERIES 1 minute since 10 minutes ago
```
- **Memory usage (active bytes):**
```sql
SELECT max(host_memory_active_bytes) from Metric
WHERE host_memory_active_bytes is NOT NULL TIMESERIES 1 minute since 10 minutes ago
```
For a comprehensive list of all metrics you can use in your dashboards, see the [Neon Metrics and Logs Reference](/docs/reference/metrics-logs).
Now that Neon's database metrics and logs are flowing into New Relic alongside your application telemetry, you can perform powerful correlational analysis to debug issues. For instance, you can directly correlate a spike in `neon_connection_counts` with error logs from a specific microservice, allowing you to quickly identify which application is causing database strain.
## Summary
Congratulations! You have successfully configured Neon to send metrics and Postgres logs to New Relic using the OpenTelemetry integration. You now have a powerful, centralized observability setup that provides real-time insights into your database's health and activity.
By leveraging this integration, you can build dashboards, set up alerts, and troubleshoot issues more effectively, all from within the New Relic platform.
## Resources
- [Neon OpenTelemetry Integration](/docs/guides/opentelemetry)
- [Neon Metrics and logs reference](/docs/reference/metrics-logs)
- [New Relic OTLP endpoint documentation](https://docs.newrelic.com/docs/opentelemetry/best-practices/opentelemetry-otlp/#configure-endpoint-port-protocol)
- [Introduction to NRQL](https://docs.newrelic.com/docs/query-your-data/nrql-new-relic-query-language/get-started/introduction-nrql-new-relics-query-language/)
- [OpenTelemetry Protocol (OTLP) Specification](https://opentelemetry.io/docs/specs/otlp/)